cytopia/metrics-server-prom
A Docker image on which Prometheus can scrape Kubernetes metrics provided by metrics-server.
10K+
cytopia/metrics-server-prom repository overview
https://github.com/cytopia/metrics-server-prom
Overview
What
A Docker image on which Prometheus can scrape Kubernetes metrics provided by metrics-server. The image can run anywhere where Prometheus can use it as a target, even in Kubernetes itself.
Why
metrics-server seems to be the successor of heapster for Kubernetes monitoring. However, metrics-server currently only provides its metrics in JSON format via the Kubernetes API server.
Prometheus on the other hand expects text-based format using EBNF syntax [1].
How
The following diagram illustrates how the format transformation is achieved:
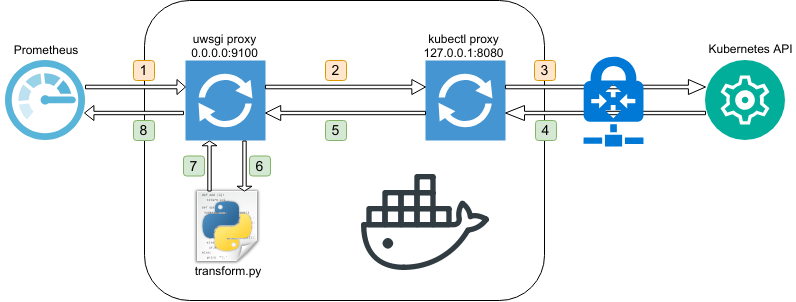
- Prometheus scrapes the Docker container on
:9100/metrics - Inside the Docker container uwsgi is proxying the request to kube proxy
- kube-proxy reads the provided config file and tunnels the request into Kubernetes to metrics-server
- metrics-server replies with JSON formatted metrics
- kube proxy forwards the request back to uwsgi
- uwsgi calls transform.py
- transform.py rewrites the JSON into Prometheus readable output and hands the result back to uwsgi
- uwsgi sends the final response back to Prometheus
Usage
Run metrics-server-prom
Simply run the Docker image with a kube config mounted into /etc/kube/config.
$ docker run -d \
    -p 9100:9100 \
    -v ${HOME}/.kube/config:/etc/kube/config:ro \
    cytopia/metrics-server-prom
If your kube config contains multiple contexts, you can tell metrics-server-prom what context
to use, to connect to the cluster.
$ docker run -d \
    -p 9100:9100 \
    -v ${HOME}/.kube/config:/etc/kube/config:ro \
    -e KUBE_CONTEXT=my-context \
    cytopia/metrics-server-prom
Configure Prometheus
prometheus.yml:
---
scrape_configs:
  - job_name: 'kubernetes'
    scrape_interval: '15s'
    metrics_path: '/metrics'
    static_configs:
      - targets:
        - <DOCKER_IP_ADDRESS>:9100
Tag summary
Content type
Image
Digest
Size
95.2 MB
Last updated
over 5 years ago
docker pull cytopia/metrics-server-prom